In this installment of the ‘Agronometrics In Charts’ series, Sarah Ilyas studies the state of the Mexican avocado market. Each week the series looks at a different horticultural commodity, focusing on a specific origin or topic visualizing the market factors that are driving change.
The US is commemorating the first-ever delivery of avocados from the Mexican state of Jalisco. The agreement was first announced in 2021 by Mexican authorities with the United States to allow avocado imports from the Mexican state.
According to a Texas A&M Study, between 1989/1990 and 2019/2020, as Mexican avocado imports move through the food supply chain, they contribute $6.5 billion in economic output and $4 billion in GDP in the U.S. economy.
According to the U.S. Department of Agriculture’s (USDA) Animal and Plant Health Inspection Service (APHIS), in terms of volume, the United States imported 1.2 million metric tons of avocados, with 1.1 million coming from Mexico (89%).
For the last full calendar year (2020) of available data, Mexico reported exports of avocados of $3.2 billion of which 79% went to the United States.
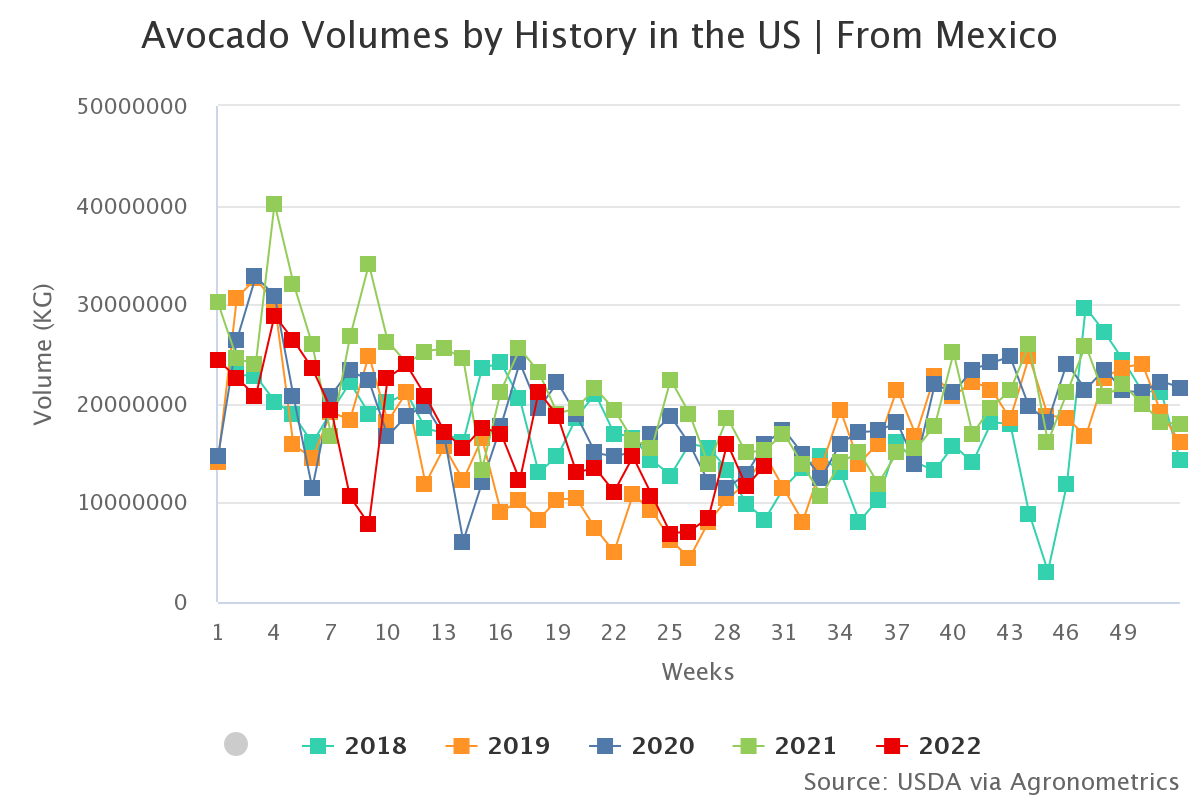
In 2020 and 2021, approximately 80% of the avocados exported from Michoacán went to U.S. markets. The highest incoming volume was recorded in January, with a total of 28K tonnes being recorded in the fourth week of the year.
Source: USDA Market News via Agronometrics. (Agronometrics users can view this chart with live updates here)
According to the Hass Avocado Board 2020 US Census Data, in the past 7 years alone, U.S. consumption of Avocados From Mexico, the number one selling avocado brand in the United States, has doubled – now at more than 8 pounds per capita per year. As depicted in the chart below, imported volumes have grown considerably in the past 22 years.
Source: USDA Market News via Agronometrics (Agronometrics users can view this chart with live updates here)
Prices had soared to about $80 per package until about a month ago, it was because the market wasn’t getting enough supply, with the entry of avocados from Jalisco that supply shortage is expected to be sealed and prices will most likely stabilize.
Source: USDA Market News via Agronometrics. (Agronometrics users can view this chart with live updates here)
Mexico currently supplies about 92% of U.S. imports of the fruit, and Mexico’s agriculture department claims that it is working to get more states certified.
The Association of Avocado Exporting Producers and Packers of Mexico (APEAM A.C.) will work in close collaboration with Jalisco to deliver increasing volumes of avocados to the U.S.
This new agreement will operate under the Cooperative Service Agreement between the USDA-Animal and Plant Health Inspection Service and APEAM. The agreement integrates 695 orchards, 9,441 hectares, 11 packing houses and 10 municipalities in Jalisco.
Avocados imported from Jalisco will adhere to the same standards to provide consumers in the U.S. with the high-quality avocados they are so familiar with.
In our ‘In Charts’ series, we work to tell some of the stories that are moving the industry. Feel free to take a look at the other articles by clicking here.
All pricing for domestic US produce represents the spot market at Shipping Point (i.e. packing house/climate controlled warehouse, etc.). For imported fruit, the pricing data represents the spot market at Port of Entry.
You can keep track of the markets daily through Agronometrics, a data visualization tool built to help the industry make sense of the huge amounts of data that professionals need to access to make informed decisions.
If you found the information and the charts from this article useful, feel free to visit us at www.agronometrics.com where you can easily access these same graphs, or explore the other 21 commodities we currently track.


